Digital Data Collection - getting started
Rolf Fredheim and Yulia Shenderovich
University of Cambridge
17/02/2015
Logging on
Before you sit down:
- Do you have your MCS password?
- Do you have your Raven password?
- If you answered 'no' to either then go to the University Computing Services (just outside the door) NOW!
- Are you registered? If not, see me!
Download these slides
Follow link from course description on the SSRMC pages or go directly to http://fredheir.github.io/WebScraping/
Download the R file to your computer
Optionally download the slides
And again, optionally open the html slides in your browser
Install the following packages:
knitr ggplot2 lubridate plyr jsonlite stringr
press preview to view the slides in RStudio
Who is this course for
Computer scientists
Anyone with some minimal background in coding and good computer literacy
By the end of the course you will have
Created a system to extract text and numbers from a large number of web pages
Learnt to harvest links
Worked with an API to gather data, e.g. from YouTube
Convert messy data into tabular data
What will we need?
A windows Computer
A modern browser - Chrome or Firefox
An up to date version of Rstudio
Getting help
- ?[functionName]
- StackOverflow
- Ask each other.
Outline
Theory
Practice
What is 'Web Scraping'?
From Wikipedia
Web scraping (web harvesting or web data extraction) is a computer software technique of extracting information from websites.
When might this be useful? (your examples)
Imposing structure on data
Again, from Wikipedia
… Web scraping focuses on the transformation of unstructured data on the web, typically in HTML format, into structured data that can be stored and analyzed in a central local database or spreadsheet.
What will we learn?
1) working with text in R
2) Connecting R to the outside world
3) Downloading from within R
Example
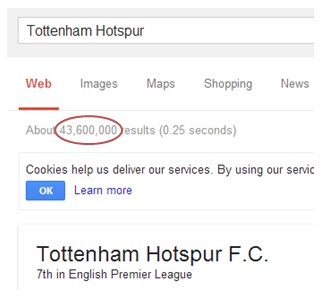
Approximate number of web pages
Tabulate this data
require (ggplot2)
clubs <- c("Tottenham","Arsenal","Liverpool",
           "Everton","ManU","ManC","Chelsea")
nPages <- c(67,113,54,16,108,93,64)
df <- data.frame(clubs,nPages)
df
      clubs nPages
1 Tottenham     67
2   Arsenal    113
3 Liverpool     54
4   Everton     16
5      ManU    108
6      ManC     93
7   Chelsea     64
Visualise it
ggplot(df,aes(clubs,nPages,fill=clubs))+
  geom_bar(stat="identity")+
  coord_flip()+theme_bw(base_size=70)

Health and Safety

Programming with Humanists: Reflections on Raising an Army of Hacker-Scholars in the Digital Humanities http://openbookpublishers.com/htmlreader/DHP/chap09.html#ch09
Why might the Google example not be a good one?
Bandwidth
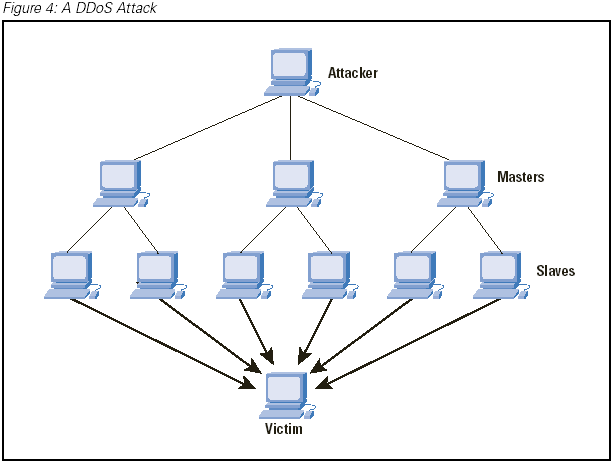
the agent machines (slave zombies) begin to send a large volume of packets to the victim, flooding its system with useless load and exhausting its resources.
source: cisco.com
We will not:
- run parallel processes
we will:
- test code on minimal data
Practice
- String manipulation
- Loops
- Scraping
The JSON data
http://stats.grok.se/json/en/201401/web_scraping
{“daily_views”: {“2013-01-12”: 542, “2013-01-13”: 593, “2013-01-10”: 941, “2013-01-11”: 798, “2013-01-16”: 1119, “2013-01-17”: 1124, “2013-01-14”: 908, “2013-01-15”: 1040, “2013-01-30”: 1367, “2013-01-18”: 1027, “2013-01-19”: 743, “2013-01-31”: 1151, “2013-01-29”: 1210, “2013-01-28”: 1130, “2013-01-23”: 1275, “2013-01-22”: 1131, “2013-01-21”: 1008, “2013-01-20”: 707, “2013-01-27”: 789, “2013-01-26”: 747, “2013-01-25”: 1073, “2013-01-24”: 1204, “2013-01-01”: 379, “2013-01-03”: 851, “2013-01-02”: 807, “2013-01-05”: 511, “2013-01-04”: 818, “2013-01-07”: 745, “2013-01-06”: 469, “2013-01-09”: 946, “2013-01-08”: 912}, “project”: “en”, “month”: “201301”, “rank”: -1, “title”: “web_scraping”}
String manipulation in R
Top string manipulation functions:
- tolower (also toupper, capitalize)
- grep
- gsub
- str_split (library: stringr) -substring
- paste and paste0
- nchar
- str_trim (library: stringr)
Reading:
Changing the case
We can apply them to individual strings, or to vectors:
tolower('ROLF')
[1] "rolf"
states = rownames(USArrests)
tolower(states[0:4])
[1] "alabama" "alaska" "arizona" "arkansas"
toupper(states[0:4])
[1] "ALABAMA" "ALASKA" "ARIZONA" "ARKANSAS"
Number of characters
We can also use this to make selections:
nchar(states)
 [1]  7  6  7  8 10  8 11  8  7  7  6  5  8  7  4  6  8  9  5  8 13  8  9
[24] 11  8  7  8  6 13 10 10  8 14 12  4  8  6 12 12 14 12  9  5  4  7  8
[47] 10 13  9  7
states[nchar(states)==5]
[1] "Idaho" "Maine" "Texas"
Cutting strings
We can use fixed positions, e.g. to get first character m
or to get a fixed part of the string: text
Can you see how this function works? If not use ?substring
str_split
- Manipulating URLs
Editing time stamps, etc
syntax: str_split(inputString,pattern) returns a list
require(stringr)
link="http://stats.grok.se/json/en/201401/web_scraping"
str_split(link,'/')
[[1]]
[1] "http:"         ""              "stats.grok.se" "json"
[5] "en"            "201401"        "web_scraping"
unlist(str_split(link,"/"))
[1] "http:"         ""              "stats.grok.se" "json"
[5] "en"            "201401"        "web_scraping"
Cleaning data
- nchar
- tolower (also toupper)
- str_trim (library: stringr)
annoyingString <- "\n something HERE \t\t\t"
nchar(annoyingString)
[1] 24
str_trim(annoyingString)
[1] "something HERE"
tolower(str_trim(annoyingString))
[1] "something here"
nchar(str_trim(annoyingString))
[1] 14
Structured practice
Remember how to read in files using R? Load in some text from the web:
require(RCurl)

download.file('https://raw.githubusercontent.com/fredheir/WebScraping/gh-pages/Lecture1_2015/text.txt',destfile='tmp.txt',method='curl')
text=readLines('tmp.txt')
- What is this? Explore the file.
- How many lines does the file have?
- print only the seventh line. Use str_split() to break it up into individual words
- How many words are there? use length() to count the number of words.
- Are any words used more than once? Use table to find out!
- Can you sort the results?
- What are the 10 most common words?
- use nchar to find the length of the ten most common words? Tip: use names()
- What about for the whole text?
Walkthrough
length(text)
text[7]
length(unlist(str_split(text[7],' ')))
table(length(unlist(str_split(text[7],' '))))
words=sort(table(length(unlist(str_split(text[7],' ')))))
tail(words)
nchar(names(tail(words)))
words=sort(table(length(unlist(str_split(text,' ')))))
tail(words)
What do they do - grep
Grep allows regular expressions in R
E.g.
grep("Ohio",states)
[1] 35
grep("y",states)
[1] 17 20 30 38 50
#To make a selection
states[grep("y",states)]
[1] "Kentucky"     "Maryland"     "New Jersey"   "Pennsylvania"
[5] "Wyoming"
Grep 2
useful options:
- invert=TRUE : get all non-matches
- ignore.case=TRUE : what it says on the box
- value = TRUE : return values rather than positions
Structured practice2
Use Grep to find all the statements including the words:
- 'London'
- 'conspiracy'
- 'amendment'
Each of the statements in our parliamentary debate begin with a paragraph sign(§)
- Use grep to select only these lines!
- How many separate statements are there?
Walkthrough2
grep('London',text)
grep('conspiracy',text)
grep('amendment',text)
grep('§',text)
length(grep('§',text))
Regex
Can match beginning or end of word, e.g.:
stalinwords=c("stalin","stalingrad","Stalinism","destalinisation")
grep("stalin",stalinwords,value=T)

#Capitalisation
grep("stalin",stalinwords,value=T)
grep("[Ss]talin",stalinwords,value=T)

#Wildcards
grep("s*grad",stalinwords,value=T)

#beginning and end of word
grep('\\<d',stalinwords,value=T)
grep('d\\>',stalinwords,value=T)
Before running these on your computer, can you figure out what they will do?
Structured practice 3
Use grep to check whether you missed some hits for above due to capitalisation (London, conspiracy, amendment)
Use the caret(^ ) character to match the start of a line. How many lines start with the word 'Amendment'?
Use the dollar($) sign to match the end of a line. How many lines end with a question mark?
Walkthrough3
grep('[Aa]mendment',text)
[1] 6 40 41 43 53 55 61 63 65
grep('^[Aa]mendment',text)
[1] 55 65
grep('\\?$',text)
[1] 9 24 47 57 59 63
What do they do: gsub
author <- "By Rolf Fredheim"
gsub("By ","",author)
[1] "Rolf Fredheim"
gsub("Rolf Fredheim","Tom",author)
[1] "By Tom"
Gsub can also use regex
Outline
Theory
Practice
Questions
1) how do we read the data from this page http://stats.grok.se/json/en/201401/web_scraping
2) how do we generate a list of links, say for the whole of 2013?
Practice
- String manipulation
- Scraping
- Loops
The URL
http://stats.grok.se/en/201401/web_scraping
- en
- 201401
- web_scraping
en.wikipedia.org/wiki/Web_scraping
Changes by hand
Paste
Check out ?paste if you are unsure about this
Bonus: check out ?paste0
var=123
paste("url",var,sep="")
[1] "url123"
paste("url",var,sep=" ")
[1] "url 123"
Paste2
var=123
paste("url",rep(var,3),sep="_")
[1] "url_123" "url_123" "url_123"
Paste3
Can you figure out what these will print?
paste("url",1:3,var,sep="_")
var=c(123,421)
paste(var,collapse="_")
With a URL
var=201401
paste("http://stats.grok.se/json/en/",var,"/web_scraping")
[1] "http://stats.grok.se/json/en/ 201401 /web_scraping"
paste("http://stats.grok.se/json/en/",var,"/web_scraping",sep="")
[1] "http://stats.grok.se/json/en/201401/web_scraping"
Task using 'paste'
- a=“test”
- b=“scrape”
- c=94
merge variables a,b,c into a string, separated by an underscore (“_”)
“test_scrape_94”
merge variables a,b,c into a string without any separating character
“testscrape94”
print the letter 'a' followed by the numbers 1:10, without a separating character
“a1” “a2” “a3” “a4” “a5” “a6” “a7” “a8” “a9” “a10”
Walkthrough
a="test"
b="scrape"
c=94

paste(a,b,c,sep='_')
paste(a,b,c,sep='')
#OR:
paste0(a,b,c)
paste('a',1:10,sep='')
Testing a URL is correct in R
Run this in your terminal:
var=201401
url=paste("http://stats.grok.se/json/en/",var,"/web_scraping",sep="")
url
browseURL(url)
Fetching data
var=201401
url=paste("http://stats.grok.se/json/en/",var,"/web_scraping",sep="")
raw.data <- readLines(url, warn="F")
raw.data
[1] "{\"daily_views\": {\"2014-01-15\": 779, \"2014-01-14\": 806, \"2014-01-17\": 827, \"2014-01-16\": 981, \"2014-01-11\": 489, \"2014-01-10\": 782, \"2014-01-13\": 756, \"2014-01-12\": 476, \"2014-01-19\": 507, \"2014-01-18\": 473, \"2014-01-28\": 789, \"2014-01-29\": 799, \"2014-01-20\": 816, \"2014-01-21\": 857, \"2014-01-22\": 899, \"2014-01-23\": 792, \"2014-01-24\": 749, \"2014-01-25\": 508, \"2014-01-26\": 488, \"2014-01-27\": 769, \"2014-01-06\": 0, \"2014-01-07\": 786, \"2014-01-04\": 456, \"2014-01-05\": 77, \"2014-01-02\": 674, \"2014-01-03\": 586, \"2014-01-01\": 348, \"2014-01-08\": 765, \"2014-01-09\": 787, \"2014-01-31\": 874, \"2014-01-30\": 1159}, \"project\": \"en\", \"month\": \"201401\", \"rank\": -1, \"title\": \"web_scraping\"}"
Fetching data2
require(jsonlite)
rd  <- fromJSON(raw.data)
rd
$daily_views
$daily_views$`2014-01-15`
[1] 779

$daily_views$`2014-01-14`
[1] 806

$daily_views$`2014-01-17`
[1] 827

$daily_views$`2014-01-16`
[1] 981

$daily_views$`2014-01-11`
[1] 489

$daily_views$`2014-01-10`
[1] 782

$daily_views$`2014-01-13`
[1] 756

$daily_views$`2014-01-12`
[1] 476

$daily_views$`2014-01-19`
[1] 507

$daily_views$`2014-01-18`
[1] 473

$daily_views$`2014-01-28`
[1] 789

$daily_views$`2014-01-29`
[1] 799

$daily_views$`2014-01-20`
[1] 816

$daily_views$`2014-01-21`
[1] 857

$daily_views$`2014-01-22`
[1] 899

$daily_views$`2014-01-23`
[1] 792

$daily_views$`2014-01-24`
[1] 749

$daily_views$`2014-01-25`
[1] 508

$daily_views$`2014-01-26`
[1] 488

$daily_views$`2014-01-27`
[1] 769

$daily_views$`2014-01-06`
[1] 0

$daily_views$`2014-01-07`
[1] 786

$daily_views$`2014-01-04`
[1] 456

$daily_views$`2014-01-05`
[1] 77

$daily_views$`2014-01-02`
[1] 674

$daily_views$`2014-01-03`
[1] 586

$daily_views$`2014-01-01`
[1] 348

$daily_views$`2014-01-08`
[1] 765

$daily_views$`2014-01-09`
[1] 787

$daily_views$`2014-01-31`
[1] 874

$daily_views$`2014-01-30`
[1] 1159


$project
[1] "en"

$month
[1] "201401"

$rank
[1] -1

$title
[1] "web_scraping"
Fetching data3
rd.views <- unlist(rd$daily_views)
rd.views
2014-01-15 2014-01-14 2014-01-17 2014-01-16 2014-01-11 2014-01-10
       779        806        827        981        489        782
2014-01-13 2014-01-12 2014-01-19 2014-01-18 2014-01-28 2014-01-29
       756        476        507        473        789        799
2014-01-20 2014-01-21 2014-01-22 2014-01-23 2014-01-24 2014-01-25
       816        857        899        792        749        508
2014-01-26 2014-01-27 2014-01-06 2014-01-07 2014-01-04 2014-01-05
       488        769          0        786        456         77
2014-01-02 2014-01-03 2014-01-01 2014-01-08 2014-01-09 2014-01-31
       674        586        348        765        787        874
2014-01-30
      1159
Fetching data4
rd.views <- unlist(rd.views)
df <- as.data.frame(rd.views)
df
           rd.views
2014-01-15      779
2014-01-14      806
2014-01-17      827
2014-01-16      981
2014-01-11      489
2014-01-10      782
2014-01-13      756
2014-01-12      476
2014-01-19      507
2014-01-18      473
2014-01-28      789
2014-01-29      799
2014-01-20      816
2014-01-21      857
2014-01-22      899
2014-01-23      792
2014-01-24      749
2014-01-25      508
2014-01-26      488
2014-01-27      769
2014-01-06        0
2014-01-07      786
2014-01-04      456
2014-01-05       77
2014-01-02      674
2014-01-03      586
2014-01-01      348
2014-01-08      765
2014-01-09      787
2014-01-31      874
2014-01-30     1159
Put it together
var=201403

url=paste("http://stats.grok.se/json/en/",var,"/web_scraping",sep="")
rd <- fromJSON(readLines(url, warn="F"))
rd.views <- rd$daily_views
df <- as.data.frame(unlist(rd.views))
Can we turn this into a function?
Select the four lines in the previous slide, go to 'code' in RStudio, and click function
This will allow you to make a function, taking one input, 'var'
In future you can then run this as follows:
df=myfunction(var)
Plot it
require(ggplot2)
require(lubridate)
df$date <-  as.Date(rownames(df))
colnames(df) <- c("views","date")
ggplot(df,aes(date,views))+
  geom_line()+
  geom_smooth()+
  theme_bw(base_size=20)

Tasks
Plot Wikipedia page views for February 2015. How do these compare with the numbers for 2014?
What about some other event? Modify the code below to checkout stats for something else?
paste(“http://stats.grok.se/json/en/”,var,“/web_scraping”,sep=“”)
Now try changing the language of the page ('en' above). How about Russian, or German?
Moving on
Now we will learn about loops
Practice
- String manipulation
- Scraping
- Loops
Idea of a loop
Purpose is to reuse code by using one or more variables. Consider:
name='Rolf Fredheim'
name='Yulia Shenderovich'
name='David Cameron'
firstsecond=(str_split(name, ' ')[[1]])
ndiff=nchar(firstsecond[2])-nchar(firstsecond[1])
print (paste0(name,"'s surname is ",ndiff," characters longer than their firstname"))
[1] "David Cameron's surname is 2 characters longer than their firstname"
Simple loops
- Curly brackets {} include the code to be executed
- Normal brackets () contain a list of variables
for (number in 1:5){
    print (number)
}
[1] 1
[1] 2
[1] 3
[1] 4
[1] 5
Looping over functions
states_first=head(states)
for (state in states_first){
    print (
        tolower(state)
    )
}
[1] "alabama"
[1] "alaska"
[1] "arizona"
[1] "arkansas"
[1] "california"
[1] "colorado"
for (state in states_first){
  print (
        substring(state,1,4)
    )
}
[1] "Alab"
[1] "Alas"
[1] "Ariz"
[1] "Arka"
[1] "Cali"
[1] "Colo"
Urls again
stats.grok.se/json/en/201401/web_scraping
for (month in 1:12){
    print(paste(2014,month,sep=""))
}
[1] "20141"
[1] "20142"
[1] "20143"
[1] "20144"
[1] "20145"
[1] "20146"
[1] "20147"
[1] "20148"
[1] "20149"
[1] "201410"
[1] "201411"
[1] "201412"
Not quite right
We need the variable 'month' to have two digits:
201401
    for (month in 1:9){
        print(paste(2012,0,month,sep=""))
    }
[1] "201201"
[1] "201202"
[1] "201203"
[1] "201204"
[1] "201205"
[1] "201206"
[1] "201207"
[1] "201208"
[1] "201209"
    for (month in 10:12){
        print(paste(2012,month,sep=""))
    }
[1] "201210"
[1] "201211"
[1] "201212"
Store the data
dates=NULL
    for (month in 1:9){
        date=(paste(2012,0,month,sep=""))
        dates=c(dates,date)
    }

    for (month in 10:12){
        date=(paste(2012,month,sep=""))
        dates=c(dates,date)
    }
print (as.numeric(dates))
 [1] 201201 201202 201203 201204 201205 201206 201207 201208 201209 201210
[11] 201211 201212
here we concatenated the values:
dates <- c(c(201201,201202),201203)
print (dates)
[1] 201201 201202 201203
!! To do this with a data.frame, use rbind()
Putting it together
  for (month in 1:9){
        print(paste("http://stats.grok.se/json/en/2013",0,month,"/web_scraping",sep=""))
    }
[1] "http://stats.grok.se/json/en/201301/web_scraping"
[1] "http://stats.grok.se/json/en/201302/web_scraping"
[1] "http://stats.grok.se/json/en/201303/web_scraping"
[1] "http://stats.grok.se/json/en/201304/web_scraping"
[1] "http://stats.grok.se/json/en/201305/web_scraping"
[1] "http://stats.grok.se/json/en/201306/web_scraping"
[1] "http://stats.grok.se/json/en/201307/web_scraping"
[1] "http://stats.grok.se/json/en/201308/web_scraping"
[1] "http://stats.grok.se/json/en/201309/web_scraping"
    for (month in 10:12){
        print(paste("http://stats.grok.se/json/en/2013",month,"/web_scraping",sep=""))
    }
[1] "http://stats.grok.se/json/en/201310/web_scraping"
[1] "http://stats.grok.se/json/en/201311/web_scraping"
[1] "http://stats.grok.se/json/en/201312/web_scraping"
Tasks about Loops
- Write a loop that prints every number between 1 and 1000
- Write a loop that adds up all the numbers between 1 and 1000
- Write a function that takes an input number and returns this number divided by two
- Write a function that returns the value 99 no matter what the input
- Write a function that takes two variables, and returns the sum of these variables
If you want to take this further....
- Can you make an application which takes a Wikipedia page (e.g. Web_scraping) and returns a plot for the month 201312
- Can you extend this application to plot data for the entire year 2013 (that is for pages 201301:201312)
- Can you expand this further by going across multiple years (201212:201301)
- Can you write the application so that it takes a custom data range?
- If you have time, keep expanding functionality: multiple pages, multiple languages. you could also make it interactive using Shiny